I am really excited about graphs and networks. I get used to the idea that everything and everyone in the world is linked to each other within a low number of connections, but still, I couldn’t imagine that you can have so many connections to one node in the network accumulated from different sources.
One day my friend noticed that my voice is different when I speak different languages. My voice in Russian has a low pitch, but when speaking in English, it sounds higher. This discovery surprised me: I’ve never noticed it by myself, so I started to think about why it happens. My first assumption was that as English is not my native language, sometimes I can be less confident in words (and especially in my pronunciation with Russian accent), so it increases the voice pitch (aka frequency). Then I started to google and out of many reddit/quora threads, I stumbled upon a blog post with a rich data analysis of voices (which additionally fascinated me as I love data).
The blog post Language pitch by Erik Bernhardsson describes the substantial pitch differences between languages and makes the assumption that “there might be a “natural” pitch of each language that is optimized for pronouncing words with the least amount of effort”. Out of all articles I found on this topic, I like this one the most, because it described the idea simply, showed conclusions based on data, and it also has details about how the analysis was performed. It sparked my interest and I wanted to see what else I can find written by this author.
[Small step back. The same day in the morning, my friend showed me Annoy library which can be used for building recommendation systems. Also, I got to know that the library was built by a Spotify engineer during their Hack Week.]
So, I opened the “About” part on Erik’ website and what I saw: “I was at Spotify for 6 years … I also open sourced a couple of tools, including … Annoy – a library to find approximate nearest neighbors in high dimensional spaces.” Ok, it seems I already had a connection to the author and now it is one more (2 in total). What else can I find on his website?
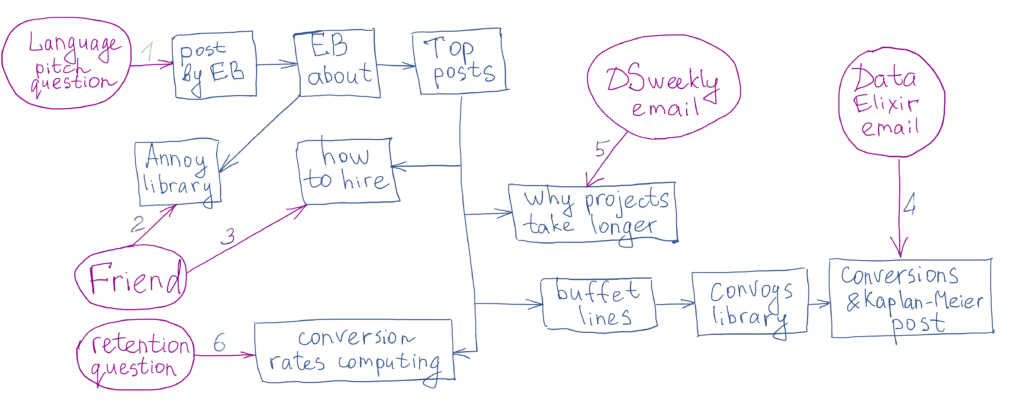
I started to skim through the Top posts and I found: “How to hire smarter than the market” – a friend cited it to me dozens of times when we talked about working in tech (counting 3 connections so far). When reading a post about simulating buffet lines, I checked a link to the convoys library which seemed familiar to me. And yeah, the github readme directed to “Modeling conversion rates and saving millions of dollars using Kaplan-Meier and gamma distributions“ – the article I read in Data Elixir mailing list in August 2019. A similar story is with the post “Why software projects take longer than you think: a statistical model“ from DataScienceWeekly mailing list from August 2019 (counting 5 connections now). One more post about conversion rates I found and shared with colleagues about a year ago when researching user retention topics (6 connections in total).
At this point, I stopped counting and just enjoyed reading Erik’s writings. What excites me is that he applies modeling and data approach to different ranges of problems: from hiring to career to management in tech, etc. That is really cool and I advise you to check his posts.
Instead of a conclusion, my handmade graph below.
And remember, graphs are everywhere!